
Understanding chart dynamics is a fundamental skill in the world of financial analysis. It involves deciphering price trends through technical analysis, which can provide valuable insights for traders and investors. By studying historical price movements and patterns, analysts can identify potential future price directions. This art of interpretation involves recognizing key chart patterns, identifying support and resistance levels and using technical indicators to assess market sentiment. It’s a skill that combines both science and intuition, as traders seek to uncover patterns and trends that can inform their investment decisions. The ability to decode chart dynamics through technical analysis empowers market participants to make more informed and strategic choices in the dynamic world of finance.
Candlestick charts: Uncovering market sentiment
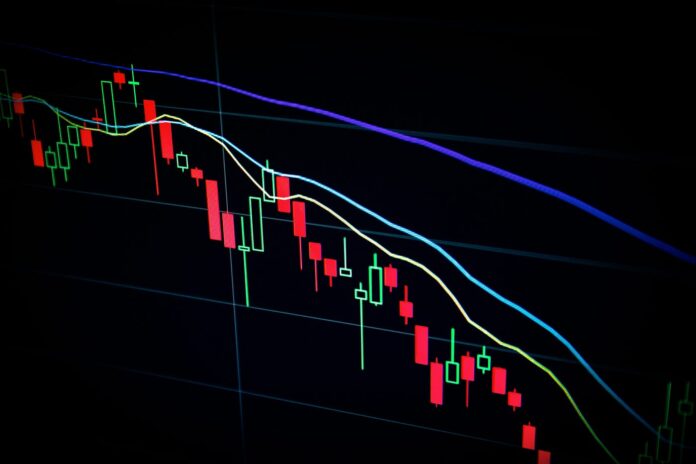
Candlestick charts are a powerful tool for analyzing market sentiment and price trends. They provide a visual representation of price movements during a specific time period, often in the form of daily or hourly candles. Each candle displays the opening, closing, high, and low prices for that period. Candlestick patterns, such as doji, hammer and engulfing patterns, offer insights into market psychology and sentiment. For example, a doji suggests market indecision, while a hammer can signal a potential reversal. Candlestick charts are widely used in technical analysis to identify entry and exit points, assess trend strength, and make informed trading decisions. Understanding these charts is essential for traders seeking to navigate the complex world of financial markets.
Averages: Identifying trend direction and strength
Averages, such as moving averages and exponential moving averages, are essential tools for identifying trend direction and strength in price analysis. Moving averages smooth out price data over a specified period, creating a line that represents the average price over time. Traders use these averages to identify trends, with the direction of the moving average indicating whether the trend is bullish (upward) or bearish (downward). The distance between the moving average and the current price reflects the strength of the trend. Crossovers between different moving averages can signal potential entry or exit points for trades. Averages provide traders with valuable insights into trend analysis and help them make more informed decisions based on trend direction and its momentum.
Support and resistance levels: Foundations of price trend analysis

Support and resistance levels are fundamental concepts in price trend analysis. Support represents a price level at which an asset tends to find buying interest and bounce back from declines. Conversely, resistance is a level at which selling interest tends to emerge, preventing the price from rising further. These levels are crucial for traders as they provide potential entry and exit points for trades. Breakouts above resistance or breakdowns below support can signal significant price movements. Support and resistance levels also help traders set stop-loss and take-profit orders to manage risk. Understanding these foundational concepts is essential for effective price trend analysis and risk management in financial markets.
Volume analysis: Assessing market participation
On the other hand, volume analysis is a critical component of technical analysis that assesses market participation and provides insights into price trends. It involves examining the trading volume accompanying price movements. Higher volume often indicates greater market interest and can confirm the strength of a price trend. Conversely, low volume may suggest a lack of conviction in the trend. Volume analysis is especially important when identifying potential reversals or breakouts. For example, a breakout accompanied by high volume is seen as more significant and reliable. Traders use volume indicators and patterns to make informed decisions, such as confirming trend strength or spotting divergence between price and volume, which can signal potential trend reversals.
Fibonacci retracement: Pinpointing potential reversal points
Fibonacci retracement is a popular tool for identifying potential reversal points in price trends. It is based on the Fibonacci sequence and the concept that price retracements often occur at specific Fibonacci levels, such as 38.2% or 61.8%. Traders use Fibonacci retracement levels to determine areas where the price may reverse or consolidate before continuing its trend. For example, if a price trend is bullish and retraces to the 61.8% Fibonacci level, traders may see it as an opportunity to enter long positions. Fibonacci retracement can be a valuable addition to technical analysis, helping traders pinpoint potential reversal zones and make well-timed trading decisions based on price retracement patterns.
Relative strength index (RSI): Gauging overbought and oversold conditions
The Relative Strength Index (RSI) is a widely used momentum oscillator that helps traders gauge overbought and oversold conditions in the market. RSI values range from 0 to 100, with readings above 70 indicating that an asset may be overbought and due for a potential reversal, while readings below 30 suggest oversold conditions and a potential upward reversal. Traders use the RSI to identify potential entry or exit points for trades. It helps assess the strength and speed of price movements, enabling traders to make informed decisions. RSI is a valuable tool in technical analysis, providing insights into market momentum and potential reversal points.
Practical applications: Making informed trading decisions

The practical application of technical analysis tools and concepts is crucial for making informed trading decisions. Traders use these tools to analyze historical price data, identify trends, and predict potential future price movements. By recognizing chart patterns, understanding support and resistance levels, and utilizing indicators like moving averages and RSI, traders gain valuable insights into market dynamics. Practical applications include setting entry and exit points for trades, managing risk through stop-loss orders, and adjusting trading strategies based on changing market conditions. The goal is to use these tools to enhance the probability of successful trades and achieve consistent profitability in the dynamic world of financial markets.
Conclusion
Understanding price trends is essential for successful trading. By decoding chart dynamics and analyzing various indicators, traders can gain valuable insights into market sentiment, trend direction, and potential reversal points. Whether you are a beginner or an experienced trader, mastering the art of interpreting price trends can greatly enhance your trading skills and improve your chances of success in the financial markets. This proficiency enables traders to make more informed decisions about entry and exit points, risk management strategies, and overall trading approaches. The ability to identify trends and patterns through technical analysis provides a solid foundation for navigating the complexities of the market and adapting to changing conditions over time.


