
Understanding mobile app analytics, especially user engagement and retention, is crucial for a mobile app’s success. Here, we look at the most vital aspects you should measure and improve to achieve user loyalty and exceptional overall results.
“You can’t improve what you don’t measure.” It’s a statement that can help you move forward, improve, and succeed personally and professionally. And it’s a reasonably logical one, right?
But do you follow this principle in your mobile app development projects?
Let’s say you’ve developed a fantastic app, it’s been in use for a while, and you also have a decent number of users. Naturally, in such a scenario, the goal is to keep those users engaged and active!
The best way to do so and ensure your product is fully functional (and your team’s hard work is paying off!) is to measure the app’s performance.
In other words, you have to track your mobile app analytics.

User engagement and retention: a core of mobile app analytics
Regardless of industry, acquiring a new customer is far more expensive than retaining an existing one. In fact, it’s five to 25 times more expensive! This can also apply to your app’s users. Therefore, it’s best to keep your existing users happy so they stay and continually contribute to your app’s growth.
User engagement and retention metrics can assist you in achieving that type of user loyalty. They are a crucial subset of user analytics that measure user interaction and interest in a particular mobile application.
Understanding these indicators allows you to approach mobile app analytics strategically and thus develop compelling user experiences that keep current users happy and new ones coming.
Top 5 user engagement and retention metrics to monitor
Here are the top 5 metrics to help you track and improve your app’s user engagement and retention.

1. Retention rate
The retention rate is the percentage of users who activated the app at least once within a specific period after installation (usually over seven, 14, 30 or 90 days). Simply said, it’s the percentage of users who continue to interact with an app over time.
To calculate the retention rate, divide the number of active users in a certain period by the number of installs in the same period.
This is one of the most crucial metrics to monitor in mobile app analytics. It allows you to see what percentage of your user base returns vs. how many are inactive. Therefore, the retention rate is a crucial indicator of how engaging and capable your app is of providing a positive user experience.
How to boost it: Gamification is one of the best strategies to increase your app retention rate. For instance, you can award users with badges and points when they complete their “achievements.” Another excellent strategy is to use eye-catching push notifications. Opt for exciting custom sounds and messages to get users’ attention and return them to the app.
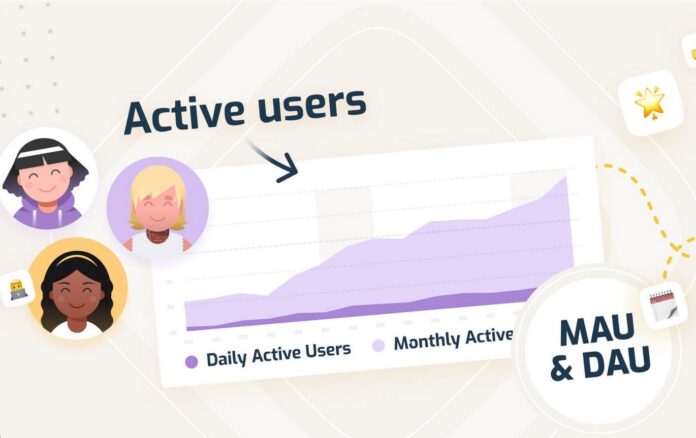
2. Daily and monthly active users
Daily active users (DAU) and monthly active users (MAU) are activity criteria that tell you the number of unique users who engage with your app over 24 hours (DAU) or 30 days (MAU).
Make use of DAU and MAU: If you observe people who have been active every day for 10 or more days in a row, these could be users who genuinely enjoy your app. This is an excellent opportunity to invite them to leave a public review and get yourself great testimonials!
You can also use DAU and MAU data to identify and win back inactive users. Send them emails or push notifications with special offers or similar products they might be interested in.
3. Stickiness rate
Another valuable function of DAU and MAU is that they let you know how “sticky” your app is. A sticky app is one that users consider necessary in their daily life. It has a devoted fan base and high engagement.
You can use the following formula to calculate the app’s stickiness rate (also known as DAU MAU ratio):
(number of DAU)/(number of MAU)*100=stickiness ratio
Monitoring this metric over time can assist in estimating the potential revenue and offers a solid picture of your app’s usefulness to users. Remember that a good DAU MAU ratio is 20%, so anything around and over this figure is what you should aim for.
How to boost it: To increase stickiness, make your app’s design frictionless and let users feel FOMO. You can achieve this by engaging them in timely communication via email or push notifications.
4. Session interval and Average session length
A session interval is the amount of time between two consecutive app sessions ― it shows the frequency with which users open and engage with the app. An average session length, on the other hand, is the time that passes between the user opening and exiting an app.
Just by looking at their definitions, we can conclude that shorter session intervals and longer average session lengths indicate more engaging apps. However, this isn’t always the case, as we must consider the app’s industry.
For example, entertainment and social media applications strive to boost average session length because it signals a compelling user experience. But, longer session intervals in banking or finance apps may result from a poor and complicated user interface.

5. Churn rate
The churn rate is the percentage of users who disengage from an app. It typically represents all lost users during a specific period, including those who have deleted the app and those who haven’t opened it in a long time.
To calculate your churn rate, use the following formula:
(number of lost users)/(number of total users)*100=churn rate
How to prevent high churn rates: The hard truth is that all apps lose some portion of their user base. However, by monitoring your mobile app analytics and taking steps to increase user engagement and retention, you may keep the churn rate under control and even lower it.
Mobile app analytics: an essential component of app success
So, it’s clear that launching your mobile app is just the first step. To succeed, you must measure its performance and keep an eye on the most crucial mobile app analytics aspects.
Furthermore, you have to experiment with various tactics and approaches to see what works best and keeps your users happy and engaged.


